ICal Charts
Chart widgets for building modern HTML5 base charts. You build rich, modern charts and bind your records yourself and utilize again and again. Totally robust and dynamic solution
Download Trial Version Online Demo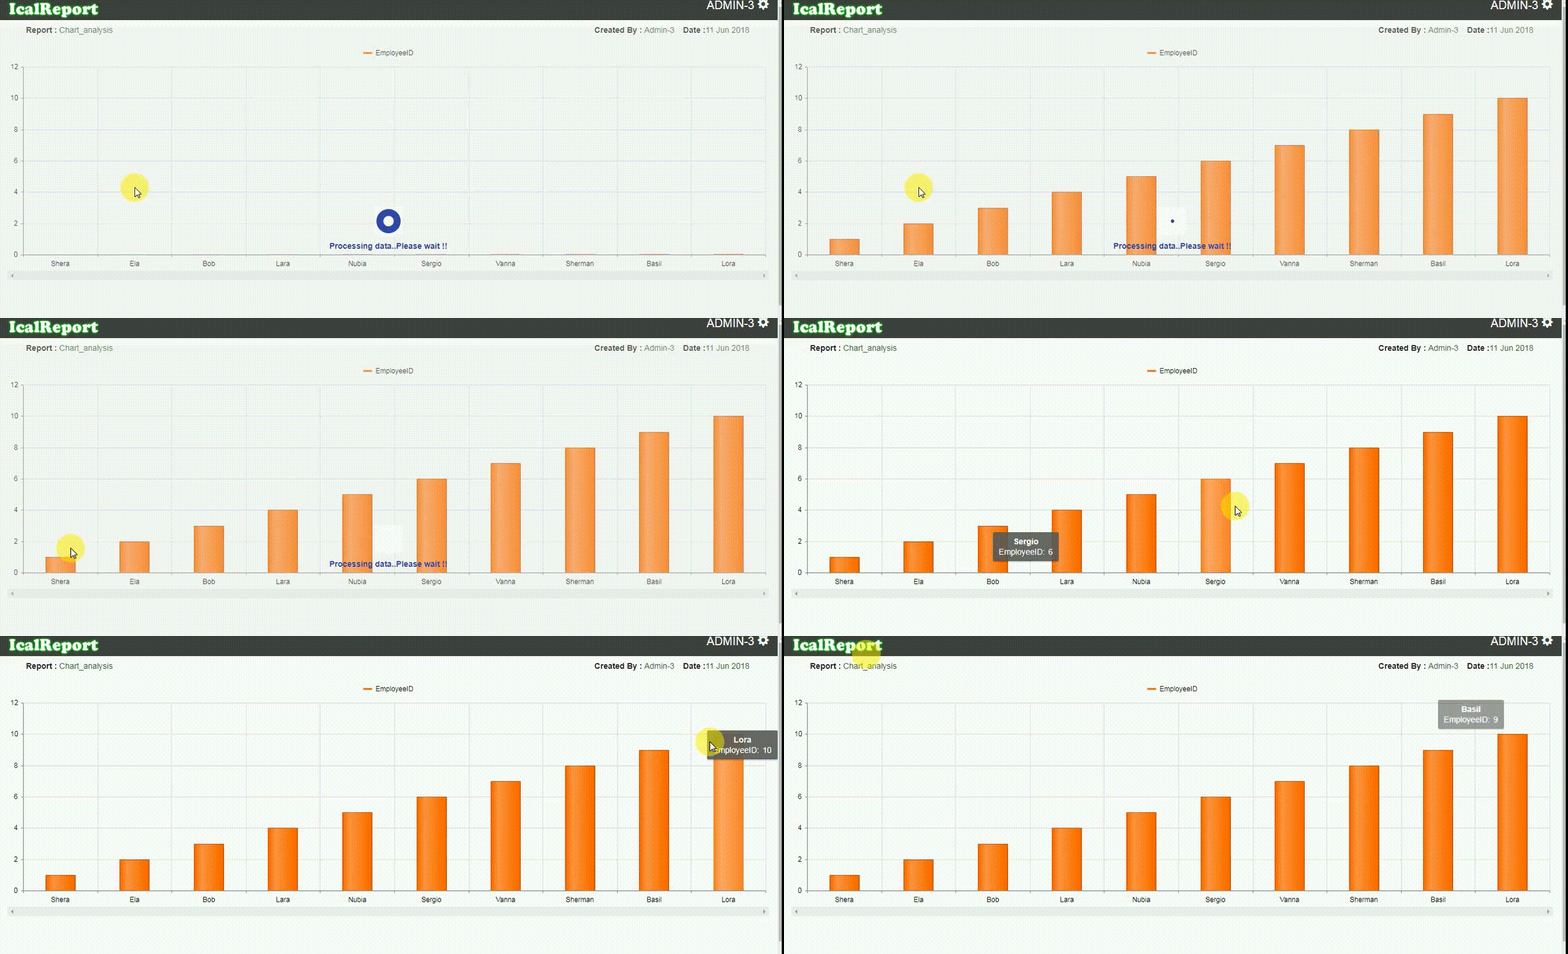
Video Guide
In this video guide you can see how to create your own chart using admin panel. You can also view other charts by just clicking on its name. In home page you will see different sections having list of charts. click on any chart name to view it in details. If you want to create your own chart follow below steps:
- Step 1 : Click on Admin panel in top-right corner.
- Step 2 : Then you will be redirected to Create Report tab.
- Step 3 : In this tab you have to give chart name, description and select section from dropdown list. Click on next to continue.. (Note: If your section name is not exist in section list then you can add it by click on Add New button.)
- Step 4 : You will be redirected to Connection String. in this tab you need to build your connection string to get list of desired tables. For that select database type, provider name from dropdown list. (Note: In this tab you will also get list of connection strings in bottom of page. if your connection string already exist you can select it from list. No need to create new connection string.)
-
Step 5 : As per selection of database type and provider name you will get further options. like
- Select database type Microsoft SQL Server and provider SQL Server then you need to give servername,username and password. then click on Get Database button to get list of database. and select any one from the list. you will see connection string in its textbox. and click on add to view it in connection string's list.
- Step 6 : After selecting connection string from list you will be redirected to next tab i.e Query
- Step 7 : In this tab you will get list of tables. select desired table and fields and click on Get Result button to continue.
- Step 8 : Here you will get selection for chart type i.e Bar Chart,Pie Chart,Line Chart. select any of them.
- Step 9 : After this select criteria for X axis from dropdown list. and click on get result for Preview.
ICal Reporting Service
A comprehensive, web based reporting service which helps to generate data script through web interface that means end user does not required to learn SQL programing to generate. You can make own report yourself with any technical skill.
Download Trial Version Online Demo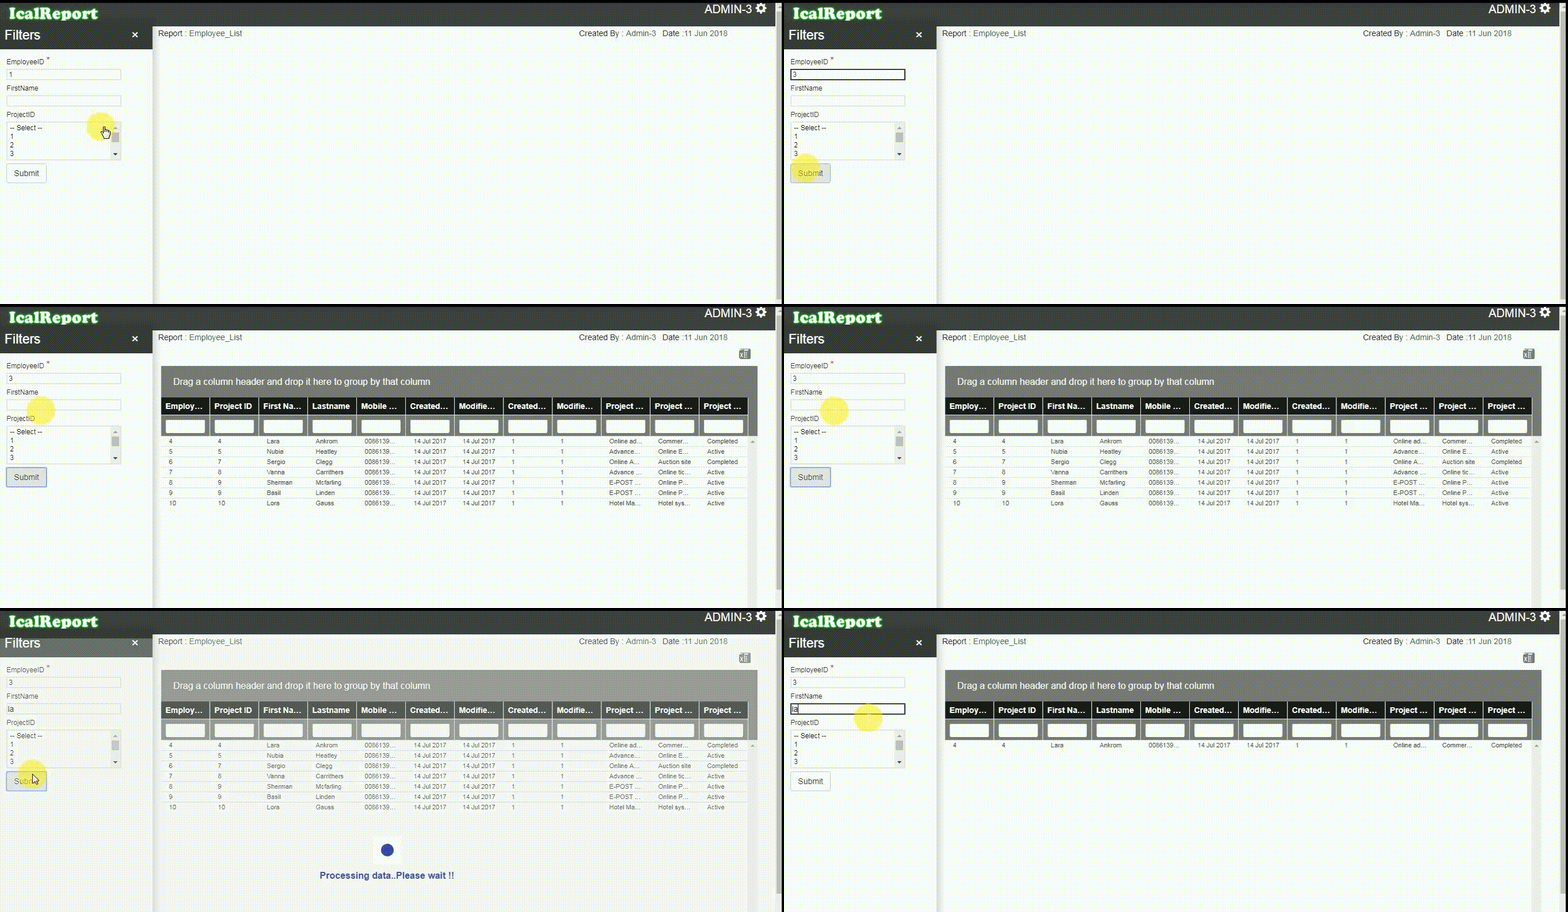
Video Guide
In this video guide you can see how to create your own report using admin panel. You can also view other reports by just clicking on its name. In home page you will see different sections having list of reports. click on any report name to view it in details. If you want to create your own report follow below steps:
- Step 1 : Click on Admin panel in top-right corner.
- Step 2 : Then you will be redirected to Create Report tab.
- Step 3 : In this tab you have to give report name, description and select section from dropdown list. Click on next to continue.. (Note: If your section name is not exist in section list then you can add it by click on Add New button.)
- Step 4 : You will be redirected to Connection String. in this tab you need to build your connection string to get list of desired tables. For that select database type, provider name from dropdown list. (Note: In this tab you will also get list of connection strings in bottom of page. if your connection string already exist you can select it from list. No need to create new connection string.)
-
Step 5 : As per selection of database type and provider name you will get further options. like
- If you select database type Microsoft SQL Server and provider SQL Server then you need to give servername,username and password. then click on Get Database button to get list of database. and select any one from the list. you will see connection string in its textbox. and click on add to view it in connection string's list.
- If you select database type JASON Service and provider JASON Web Service then you need to give Service url and click on get result button.
- If you select database type SOAP Service and provider SOAP Web Service then you need to give Service url and click on get result button.
- Step 6 : After selecting connection string from list you will be redirected to next tab i.e Query
- Step 7 : In this tab you will get list of tables. select desired table and fields and click on Get Result button to get Preview.
ICal Scheduler
Required multi dimension, huge amount of data in few seconds. Our schedule framework is light and perfect solution for you.
Download Trial Version Online Demo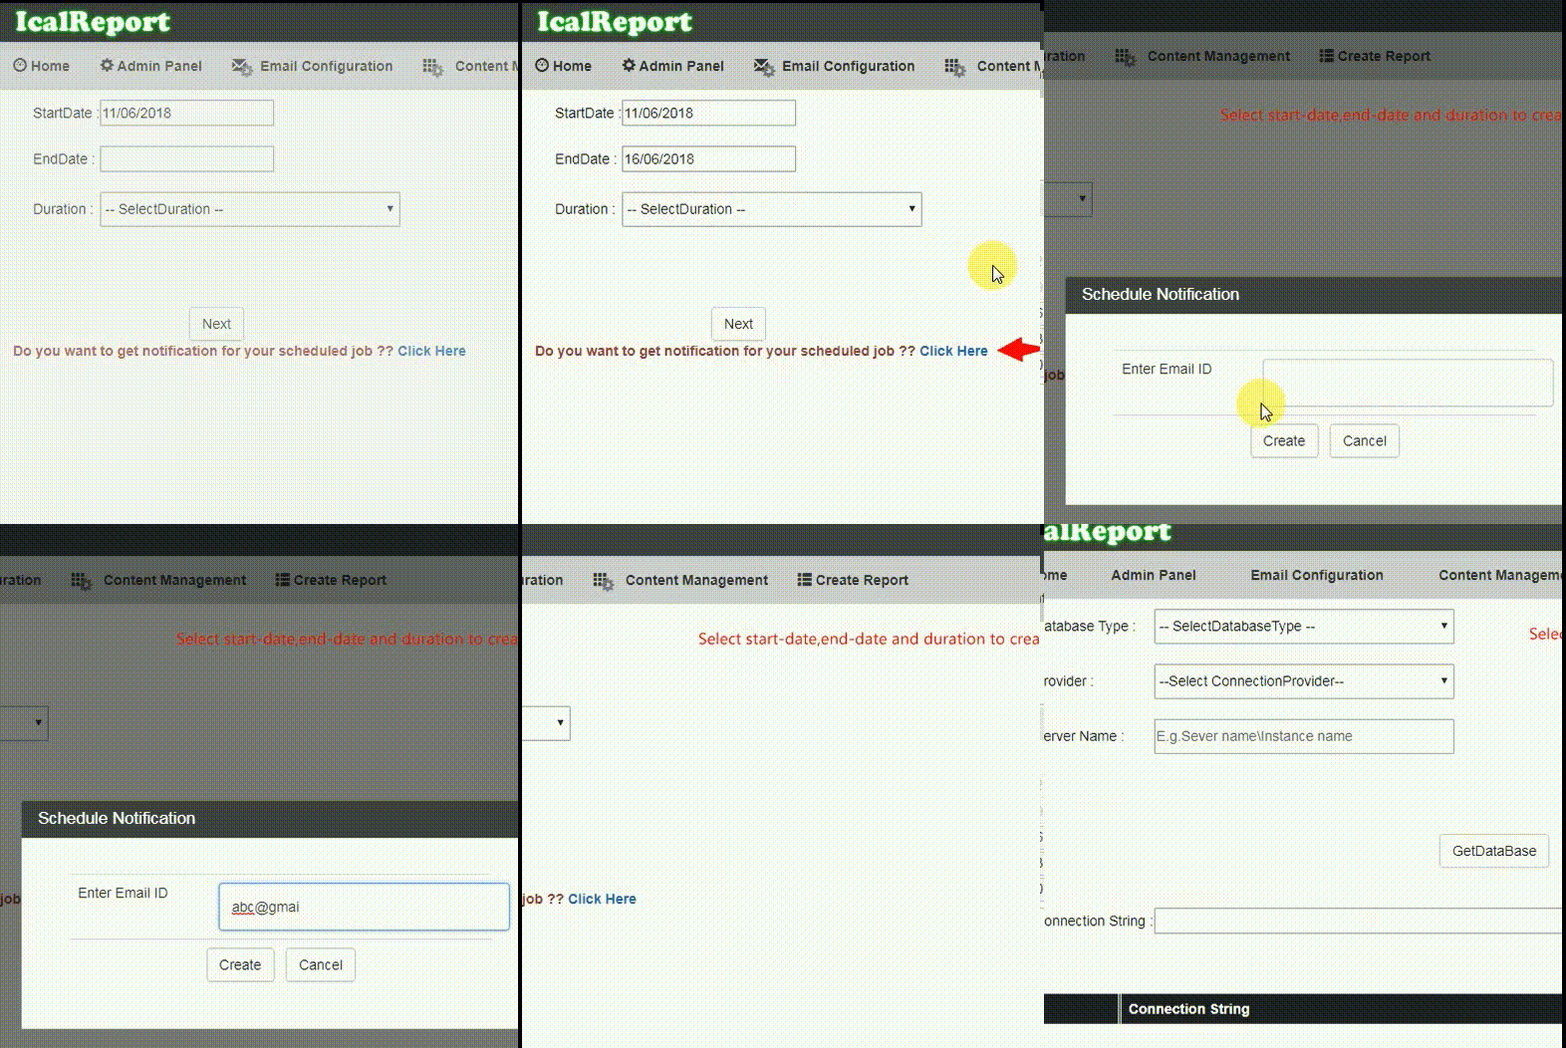
Video Guide
In this video guide you can see how to schedule your own job using admin panel. You can also view other scheduled jobs by just clicking on its name. In home page you will see different sections having list of reports. click on any job name to view it in details. If you want to schedule your own job follow below steps:
- Step 1 : Click on Admin panel in top-right corner.
- Step 2 : Then you will be redirected to Create Report tab.
- Step 3 : In this tab you have to give report name, description and select section from dropdown list. Click on next to continue.. (Note: If your section name is not exist in section list then you can add it by click on Add New button.)
- Step 4 : Now you will be redirected to another page which contains textbox for start date and end date. By default current date will be as start date. you can change it using calender control by clicking on its texbox. and select duration from dropdown list.
- Step 5 : You will be redirected to Connection String. in this tab you need to build your connection string to get list of desired tables. For that select database type, provider name from dropdown list. (Note: In this tab you will also get list of connection strings in bottom of page. if your connection string already exist you can select it from list. No need to create new connection string.)
-
Step 6 : As per selection of database type and provider name you will get further options. like
- If you select database type Microsoft SQL Server and provider SQL Server then you need to give servername,username and password. then click on Get Database button to get list of database. and select any one from the list. you will see connection string in its textbox. and click on add to view it in connection string's list.
- If you select database type JASON Service and provider JASON Web Service then you need to give Service url and click on get result button.
- If you select database type SOAP Service and provider SOAP Web Service then you need to give Service url and click on get result button.
- Step 7 : After selecting connection string from list you will be redirected to next tab i.e Query
- Step 8 : In this tab you will get list of tables. select desired table and fields and click on Get Result to get preview in grid. else click on Get Result In Chart to get preview in chart.
- Step 9 : If you select result in chart then you will be redirected to another tab to select chart type and x-axis value.
- Note: Once your job is scheduled it will be updated in given duration.
ICal Dashboard
Self-driven Ical Dashboard feature could help to make all major information at one sport, like other widgets Ical Dashboard also created by end user through few configuration (no technical skill required).
Download Trial Version Online Demo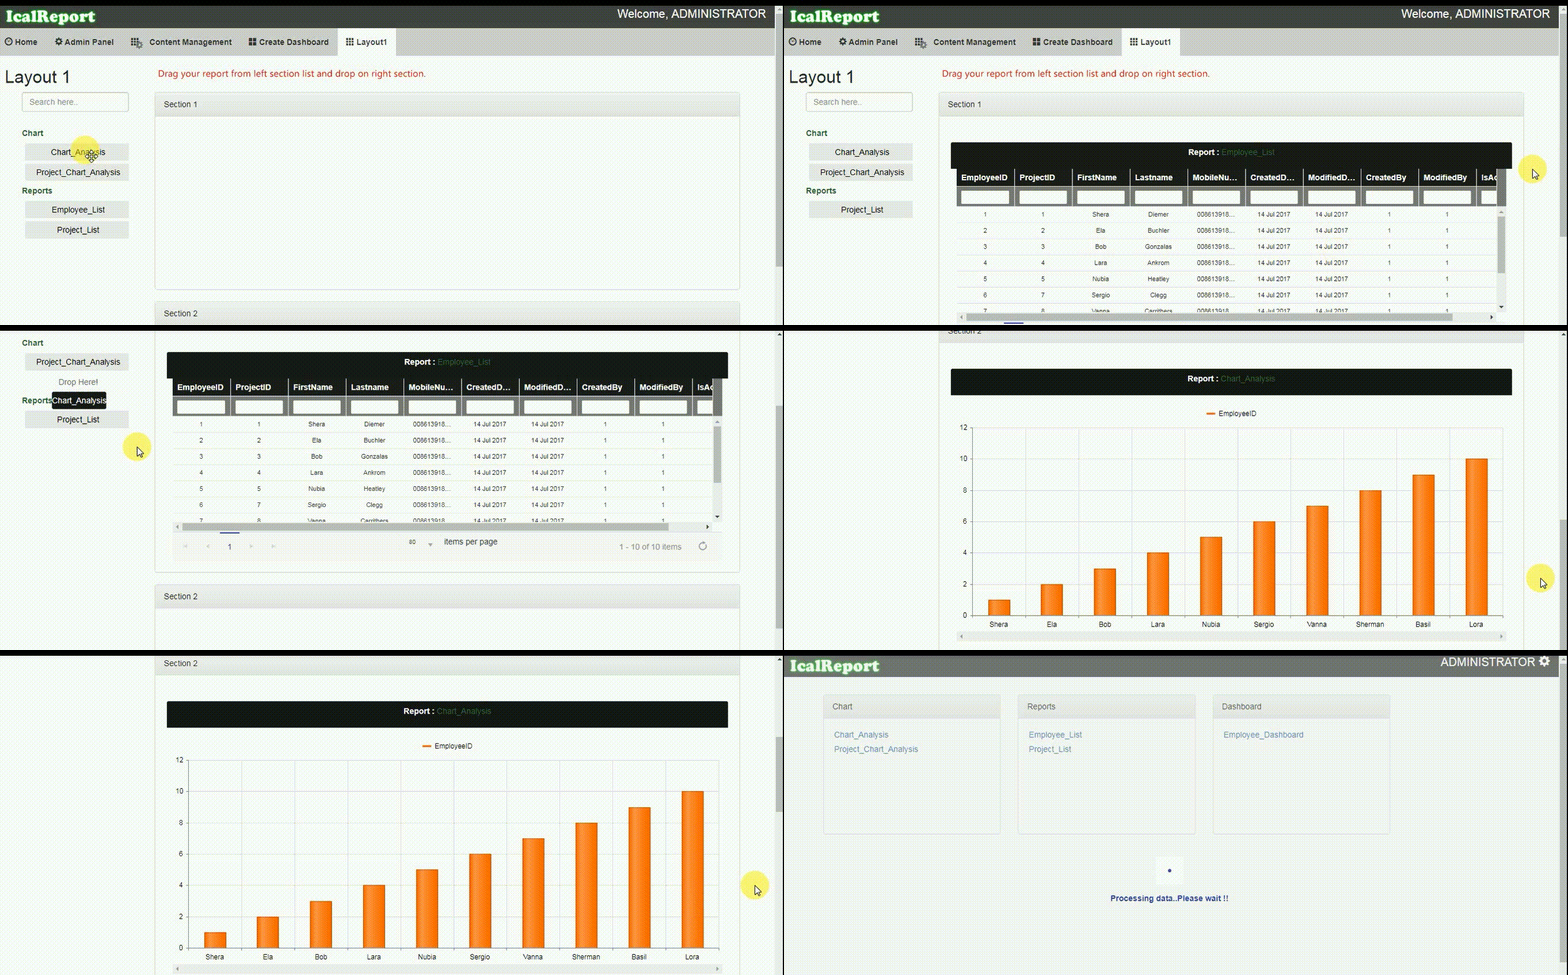
Video Guide
In this video guide you can see how to create your own dashboard using admin panel. You can also view other dashboards by just clicking on its name. In home page you will see different sections having list of dashboards. click on any dashboard name to view it in details. If you want to create your own dashboard follow below steps:
- Step 1 : Click on Admin panel in top-right corner.
- Step 2 : Then you will be redirected to Create Dashboard tab.
- Step 3 : In this tab you have to give dashboard name and select layout type from dropdown list. Click on next to continue..
- Step 4 : As per selected layout type you will get number of blocks in page.
- Step 5 : Each block contains textbox to write. Write your report name to be displayed in that block.
- Step 6 : Then click on submit to save your dashboard.
ICal Analysis Service
Expertly Engineered UI Components for multi-dimension data (CUBE). Built from ground up specifically for data analysis. No Compromises. Take them for a test-drive.
Download Trial Version Online Demo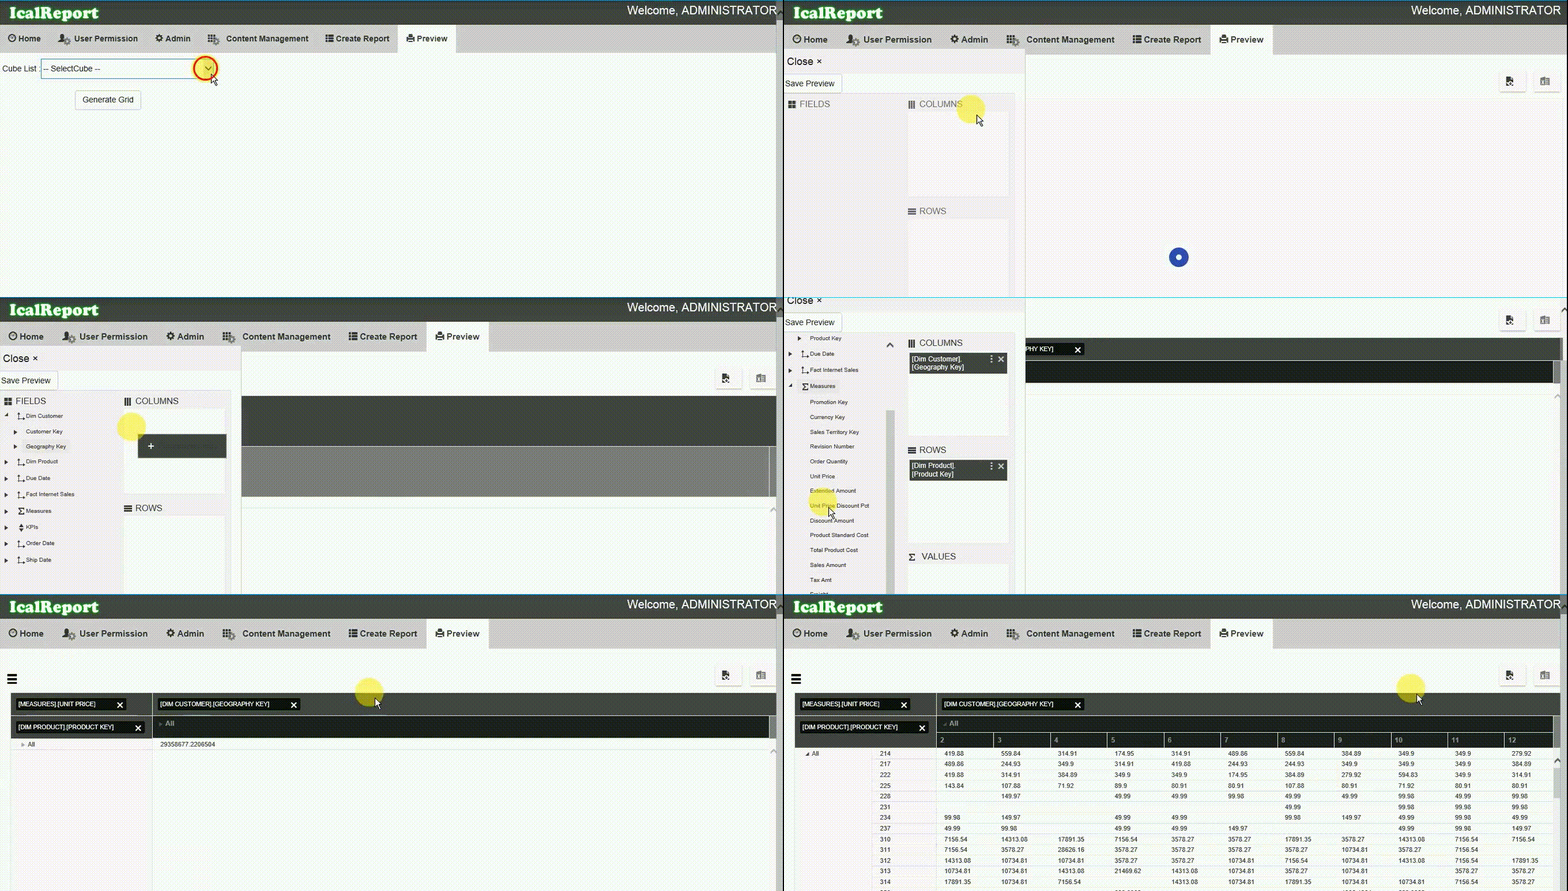
Video Guide
In this video guide you can see how to create your own report using admin panel. You can also view other reports by just clicking on its name. In home page you will see different sections having list of reports. click on any report name to view it in details. If you want to create your own report follow below steps:
- Step 1 : Click on Admin panel in top-right corner.
- Step 2 : Then you will be redirected to Create Report tab.
- Step 3 : In this tab you have to give report name, description and select section from dropdown list. Click on next to continue.. (Note: If your section name is not exist in section list then you can add it by click on Add New button.)
- Step 4 : You will be redirected to Connection String. in this tab you need to build your connection string to get list of desired tables. For that select database type, provider name from dropdown list. (Note: In this tab you will also get list of connection strings in bottom of page. if your connection string already exist you can select it from list. No need to create new connection string.)
-
Step 5 : As per selection of database type and provider name you will get further options. like
- Select database type SQL Server Analysis Service and provider MSOLAP then you need to give servername and initial catalog. then click on build connection string, you will see connection string in its textbox. and click on add to view it in connection string's list.
- Step 6 : After selecting connection string from list you will be redirected to next tab
- Steo 7 : In this tab you need to select measures,cubes,columns and rows to get your desired result.
- Step 8 : After selecting all criteria click on get result to get Preview
ICal Spreadsheet
Self-driven Ical Spreadsheet feature could help to make all major information at one sport, like other widgets Ical Spreadsheet also created by end user through few configuration (no technical skill required).Expertly Engineered UI Components to import excel file from local computer.
Download Trial Version Online Demo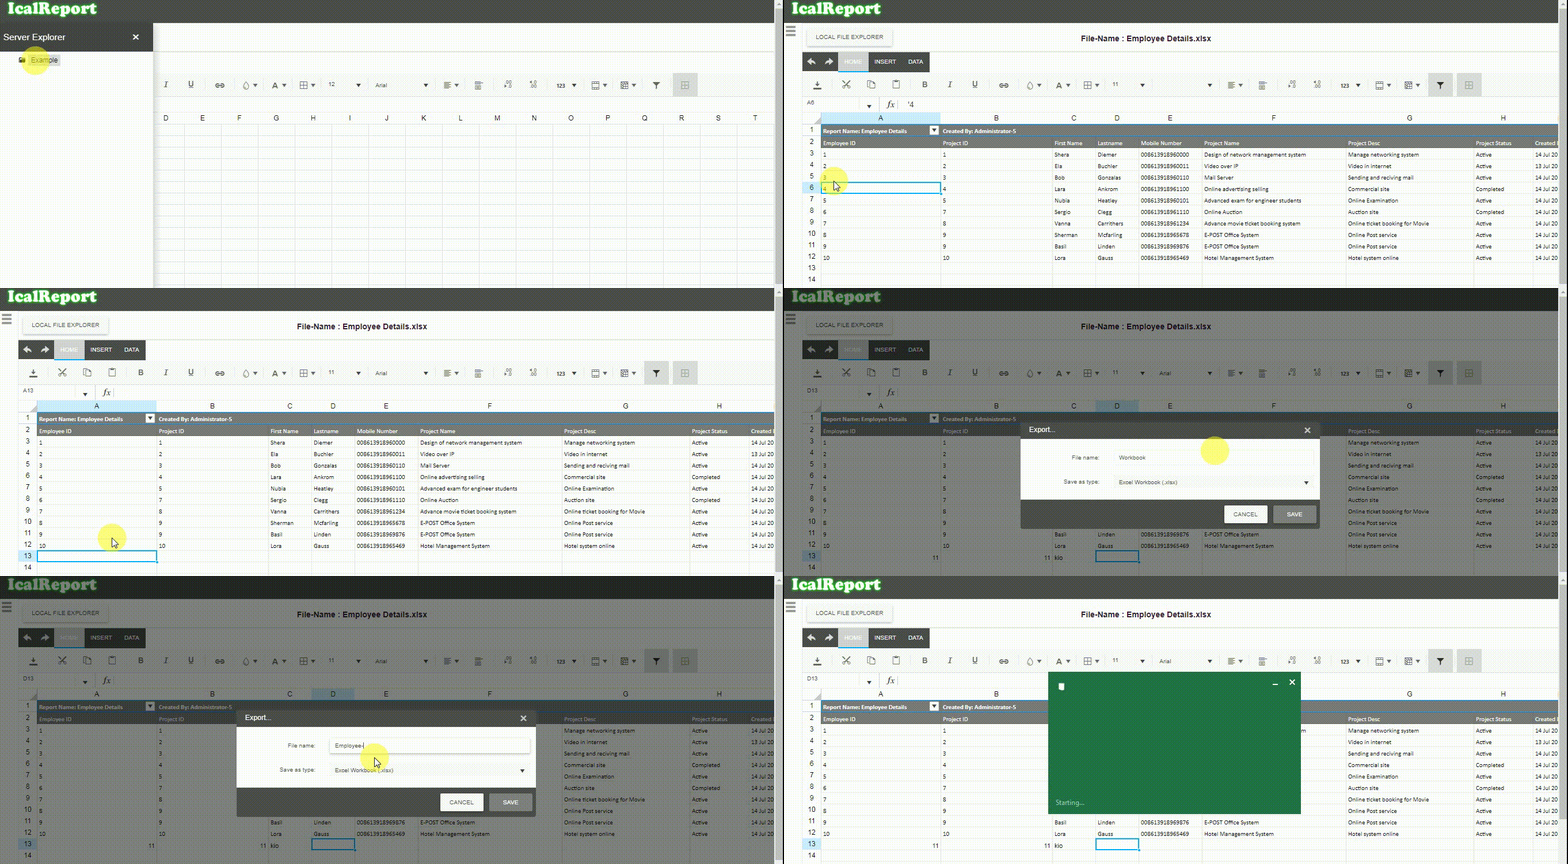
Video Guide
In this video guide you can browse your own Spreadsheet from server/local computer.If you want to experience our product please follow below steps:
- Step 1 : Click on select files button to select your own excel file.
- Step 2 : As soon as you select file its data will be displayed in below sheet.
- Step 3 : You can filter and change your data
- Step 4 : You can also export that updated excel by click on download button from toolbar.
Prerequisite
Supported Operating System
- Windows 7 Service Pack 1 Windows 8
- Windows 8.1
- Windows Server 2008 R2 SP1
- Windows Server 2008 Service Pack 2
- Windows Server 2012
- Windows Server 2012 R2
- Windows Vista Service Pack 2
Supported Database
- Micorsoft SQL Server 2008
- Microsoft SQL Server 2012
- Microsoft SQL Server 2014
Hardware Requirements:
- 1 GHz or faster processor
- 8 GB of RAM
- 4 GB of hard disk
Other Requirements:
- IIS Version 6.1 or greater
- .NET Framework 4.5 and above
- ASP.NET 4.0 and above